Control F'd: Painless live data visualizations:
via controlfd.com
Behold, a live visualization of the active content on the various StackExchange communites.
via controlfd.com
Behold, a live visualization of the active content on the various StackExchange communites.
via thecreatorsproject.vice.com
 Images courtesy the artist
Elon Musk recently stated his belief that we are probably living inside a simulated reality. Those paying attention might have noted the simulation argument he references, made by Swedish philosopher Nick Bostrom. The theory is a bit heady, but Bostrom basically argues that it’s statistically likely we’re living in a simulation.
London-based portrait photographer Ollie Ma’ is also intrigued by Bostrom’s simulation theory. So much so that he decided to create a photo series that explores it through the digital imagery of Grand Theft Auto V, interspersed with his usual photographic portraiture titled Open World. The output is a striking mirror of Ma’s carefully framed and staged photographs.

“Bostrom believes that if humans get to the stage where we can create what he calls ‘ancestor-simulations’ then there is a very high probability that we are living in a simulation ourselves,” Ma’ tells The Creators Project. “I made photographs in both Grand Theft Auto and in the real world to show what our current simulations look like in relation to reality. A side effect of this is that when compared with a simulation, reality itself begins to look like a simulation.”
Ma’ shot his Grand Theft Auto V images in “director mode,” which allows users to choose actors and stage scenes.

“You can then move around freely with a camera to compose the photograph,” Ma’ explains. “The process of constructing scenes in this way is similar to how I work in the real world.”
The genius of Ma’s work is that, at least at first glance, a viewer has a hard time telling the difference between real and virtual photographs—a very clever conceptual riff on Bostrom’s simulation thesis. Imagine how difficult it will become distinguish the real from the virtual as graphics and rendering power continues to multiply exponentially.


Click here to see more work by Ollie Ma’.
Related:
‘GTA V’ Captain Planet, He’s Our Hero
So This Is Why GTA 5 Was Made For PC
These Are the First Great 'Grand Theft Auto V’ Videos Made by Players
Remember this? Ok,
maybe you never read that. The gist of the post is that I used strace -r -T to
produce some logs that we «amassed[sic] […] with a python script for generating[sic]
a CSV file […] and we got a very interesting graph». Mein Gott, sometimes the
English I write is terrible… Here’s that graph again:
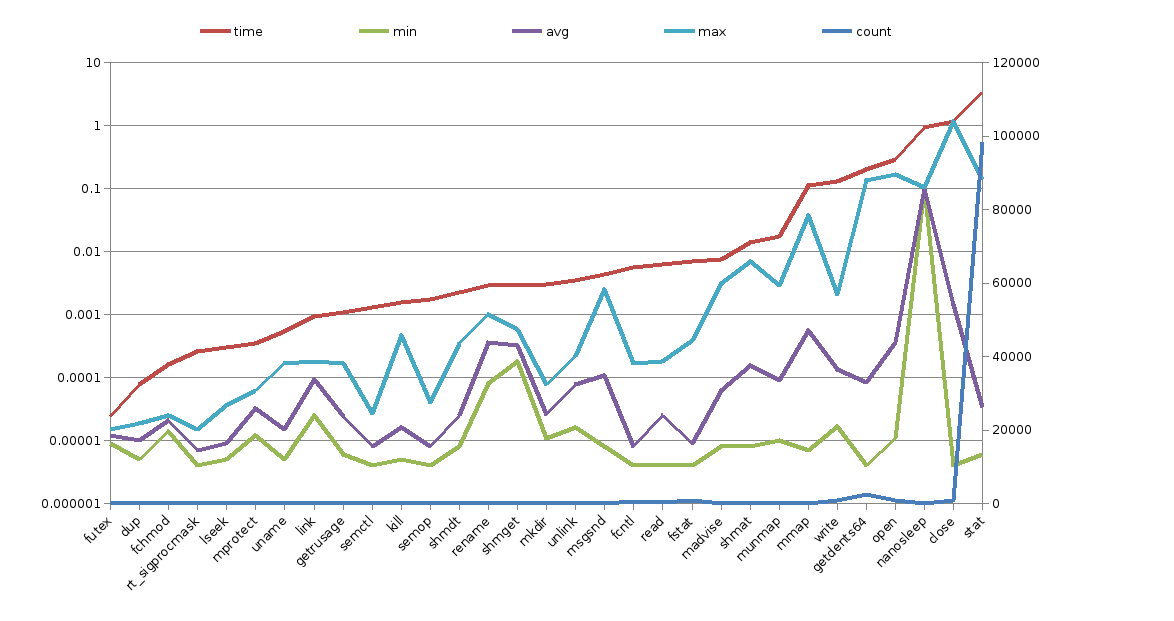
This post is to announce that that Python script is now public. You can find it
here. It’s not as fancy as those flame
graphs you see everywhere else, but it’s a good first impression, specially if you have
to wait until the SysAdmin installs perf or any other tool like that (ok, let’s be
fair, l/strace is not a standard tool, but probably your grumpy SysAdmin will
be more willing to install those than something more intrusive; I know it happened to
me, at least). It’s written in Python3; I’ll probably backport it to Python2 soon,
so those stuck with it can still profit from it.
To produce a similar graph, use the --histogram option, then follow the
suggestions spewed to stderr. I hope this helps you solve a problem like it did to
me!
profilingpython
via wescpy.blogspot.com
'https://www.googleapis.com/auth/spreadsheets'— Read/write access to Sheets and Sheet properties'sheets' and the version string to use is 'v4' as we call the apiclient.discovey.build() function:SHEETS = discovery.build('sheets', 'v4', http=creds.authorize(Http()))dict as the) body, but a better bare minimum would be a name for the Sheet, so that’s what data is for:data = {'properties': {'title': 'Toy orders [%s]' % time.ctime()}}spreadsheets().create()], passing in data in the (eventual) request body: res = SHEETS.spreadsheets().create(body=data).execute()data = {
'name': 'Toy orders [%s]' % time.ctime(),
'mimeType': 'application/vnd.google-apps.spreadsheet',
}
res = DRIVE.files().create(body=data).execute() # insert() for v2
The general rule-of-thumb is that if you’re only working with Sheets, you can do all the operations with its API, but if creating files other than Sheets or performing other Drive file or folder operations, you may want to stick with the Drive API. You can also use both or any other Google APIs for more complex applications. We’ll stick with just the Sheets API for now. After creating the Sheet, grab and display some useful information to the user: SHEET_ID = res['spreadsheetId']You may be wondering: Why do I need to create a Sheet and then make a separate API call to add data to it? Why can’t I do this all when creating the Sheet? The answer (to this likely FAQ) is you can, but you would need to construct and pass in a JSON payload representing the entire Sheet—meaning all cells and their formatting—a much larger and more complex data structure than just an array of rows. (Don’t believe me? Try it yourself!) This is why we have all of the
print('Created "%s"' % res['properties']['title'])
spreadsheets().values() methods… to simplify uploading or downloading of only values to or from a Sheet. db.sqlite) available from the Google Sheets Node.js codelab. The next block of code just connects to the database with the standard library sqlite3 package, grabs all the rows, adds a header row, and filters the last two (timestamp) columns: FIELDS = ('ID', 'Customer Name', 'Product Code', 'Units Ordered',
'Unit Price', 'Status', 'Created at', 'Updated at')
cxn = sqlite3.connect('db.sqlite')
cur = cxn.cursor()
rows = cur.execute('SELECT * FROM orders').fetchall()
cxn.close()
rows.insert(0, FIELDS)
data = {'values': [row[:6] for row in rows]}
When you have a payload (array of row data) you want to stick into a Sheet, you simply pass in those values to spreadsheets().values().update() like we do here: SHEETS.spreadsheets().values().update(spreadsheetId=SHEET_ID,The call requires a Sheet’s ID and command body as expected, but there are two other fields: the full (or, as in our case, the “upper left” corner of the) range of cells to write to (in A1 notation), and valueInputOption indicates how the data should be interpreted, writing the raw values (“RAW”) or interpreting them as if a user were entering them into the UI (“USER_ENTERED”), possibly converting strings & numbers based on the cell formatting.
range='A1', body=data, valueInputOption='RAW').execute()
print('Wrote data to Sheet:')
rows = SHEETS.spreadsheets().values().get(spreadsheetId=SHEET_ID,
range='Sheet1').execute().get('values', [])
for row in rows:
print(row)
The API call returns a dict which has a ‘values’ key if data is available, otherwise we default to an empty list so the for loop doesn’t fail. $ python3 sheets-toys.py # or python (2.x)
Created "Toy orders [Thu May 26 18:58:17 2016]" with this data:
['ID', 'Customer Name', 'Product Code', 'Units Ordered', 'Unit Price', 'Status']
['1', "Alice's Antiques", 'FOO-100', '25', '12.5', 'DELIVERED']
['2', "Bob's Brewery", 'FOO-200', '60', '18.75', 'SHIPPED']
['3', "Carol's Car Wash", 'FOO-100', '100', '9.25', 'SHIPPED']
['4', "David's Dog Grooming", 'FOO-250', '15', '29.95', 'PENDING']
['5', "Elizabeth's Eatery", 'FOO-100', '35', '10.95', 'PENDING']
'''sheets-toys.py -- Google Sheets API demo
created Jun 2016 by +Wesley Chun/@wescpy
'''
from __future__ import print_function
import argparse
import sqlite3
import time
from apiclient import discovery
from httplib2 import Http
from oauth2client import file, client, tools
SCOPES = 'https://www.googleapis.com/auth/spreadsheets'
store = file.Storage('storage.json')
creds = store.get()
if not creds or creds.invalid:
flags = argparse.ArgumentParser(parents=[tools.argparser]).parse_args()
flow = client.flow_from_clientsecrets('client_id.json', SCOPES)
creds = tools.run_flow(flow, store, flags)
SHEETS = discovery.build('sheets', 'v4', http=creds.authorize(Http()))
data = {'properties': {'title': 'Toy orders [%s]' % time.ctime()}}
res = SHEETS.spreadsheets().create(body=data).execute()
SHEET_ID = res['spreadsheetId']
print('Created "%s"' % res['properties']['title'])
FIELDS = ('ID', 'Customer Name', 'Product Code', 'Units Ordered',
        'Unit Price', 'Status', 'Created at', 'Updated at')
cxn = sqlite3.connect('db.sqlite')
cur = cxn.cursor()
rows = cur.execute('SELECT * FROM orders').fetchall()
cxn.close()
rows.insert(0, FIELDS)
data = {'values': [row[:6] for row in rows]}
SHEETS.spreadsheets().values().update(spreadsheetId=SHEET_ID,
    range='A1', body=data, valueInputOption='RAW').execute()
print('Wrote data to Sheet:')
rows = SHEETS.spreadsheets().values().get(spreadsheetId=SHEET_ID,
    range='Sheet1').execute().get('values', [])
for row in rows:
    print(row)
You can now customize this code for your own needs, for a mobile frontend, devops script, or a server-side backend, perhaps accessing other Google APIs. If this example is too complex, check the Python quickstart in the docs that way simpler, only reading data out of an existing Sheet. If you know JavaScript and are ready for something more serious, try the Node.js codelab where we got the SQLite database from. That’s it… hope you find these code samples useful in helping you get started with the latest Sheets API!via prostheticknowledge.tumblr.com
Motion Graphics reel from Method Design presents motion captured dancers in various renderings, notable for some impressive realistic physics:
Method Design was tapped by production company RSA to concept and create this year’s sponsor reel for AICP at the MoMA The AICP awards celebrate global creativity within commercial production. Method Design wanted to create an entertaining piece of design that encapsulates the innovative and prolific nature of this industry. Our aim was to showcase the AICP sponsors as various dancing avatars which playfully reference the visual effects used throughout production. Motion capture, procedural animation and dynamic simulations combine to create a milieu of iconic pop dance moves that become an explosion of colorful fur, feathers, particles and more.
via thenewstack.io
Delivering life-saving medical supplies in developing nations can be a nightmare. Without an infrastructure of well-paved roads or strong law enforcement, roads can be impassable for months at a time, or vulnerable to hijacking by bandits.
Perhaps not so surprisingly, this is where drones can save the day — or at least, that’s what American company Zipline International is counting on. The Silicon Valley startup is now piloting a drone delivery service in the African nation of Rwanda, which will see the company’s fleet of custom-built drones, nicknamed “Zips,” delivering things like medicine and even blood.
Medical personnel would order supplies via phone or text message. Within minutes, the order is filled out at one of the Zipline distribution centers and the package loaded onto one of the unmanned, fixed-wing Zip drones, which will use military-grade GPS to navigate itself at speeds of up to 62 miles per hour to the drop-off point. Upon its arrival, doctors would be alerted as the package is dropped onto the ground via parachute, accurate within an area of a few parking spaces. After delivery, the drone returns to its warehouse, where a new package will be loaded on and a freshly charged battery installed.
Designed by engineers who earned their stripes at NASA, Boeing and SpaceX, Zipline’s durable, electrically powered drones each weighs about 22 pounds, and are capable of carrying up to three pounds of cargo. They have a range of about 75 miles per battery charge, and the company says that its decentralized network of Zips will be able to deliver packages within 30 minutes, meaning that supplies do not need to be refrigerated during transit.
The Zipline model of delivery is much more cost-effective too: each trip will require less money and fuel than a comparable trip via motorcycle, and will be much more reliable as well.

Marked with a rugged, challenging topography, Rwanda is informally known as the “Land of A Thousand Hills.” Despite its other shortcomings, the Rwandan government has demonstrated a surprisingly forward-thinking approach to tech in the last couple of decades, slowly leaving the painful legacy of its 1994 genocide behind and engendering a new generation of entrepreneurs and an influx of foreign companies eager to invest here.
Zipline’s CEO and co-founder, Keller Rinaudo, who signed a partnership deal to test a fleet of 15 Zips that will serve half of Rwanda starting in July, says that the country’s relatively unregulated airspace is a unique opportunity for projects like Zipline.
“The U.S. has one of the most complicated airspaces in the world and for that reason the (Federal Aviation Administration) is even more risk-averse than most regulators,” Rinaudo told the Canadian Broadcasting Corporation. “So I think where this will start is in environments where the need is incredibly high, and the airspace is relatively empty.”
If the pilot project to deliver to twenty Rwandan hospitals and health centers this summer is successful, the company intends to launch more distribution centers to deliver supplies to all of Rwanda starting early next year. Incredibly, according to the company, all that is needed to serve the entire country of 10 million inhabitants is two hubs, housed in retrofitted shipping containers, and a fleet of around 30 unmanned aerial vehicles.

Zipline also hopes to offer other kinds of medical supplies like vaccines and antidotes to venoms in the future, along with home deliveries. Zipline has its sights set on expanding to other developing nations as well. According to the company, there is a huge market waiting to be tapped: Worldwide, more than two billion people lack adequate access to medical products, leading to a staggering number of what could be preventable deaths.
Zipline’s innovative use of drones is yet another example of how these machines are changing our world, disrupting business-as-usual and almost effortlessly leapfrogging over previously unsurmountable obstacles. Medical supplies are just the first step; tomorrow drones may be delivering organ transplants in India, fighting wildfires alongside human firefighters, or used as a less labor-intensive, drone-assisted form of “precision farming” that will increase crop yields. Safety and regulation will no doubt be an issue, but whatever the future of drones may portend, it’s bound to be interesting.
Images: Zipline International
The post Drones to Deliver Life-Saving Medical Supplies to Rwanda appeared first on The New Stack.
via feeds.christianitytoday.com
Suffering for the believer is never without purpose.
“Why?” is the question many of us ask of the Lord when something tragic happens in our lives or in the life of someone we know. There’s story after story of suffering in the Bible, but very seldom do we know why the people suffered. On this topic Paul wrote:
We also rejoice in our afflictions, because we know that affliction produces endurance, endurance products proven character, and proven character produces hope. This hope will not disappoint us, because God’s love has been poured out in our hearts through the Holy Spirit who was given to us.
Romans 5:3-5
Rejoicing in the midst of suffering focuses our attention on the knowledge of what the Spirit produces in us through that suffering. The result is threefold: suffering produces endurance, endurance produces character, and character produces hope.
Suffering Unleashes Endurance
Endurance in the Bible means steadfast adherence to a course of action in spite of difficulties and testing. As we go through trials, we develop greater perseverance to deal with increased challenges. Consider James’s words on the subject:
Consider it a great joy, my brothers, whenever you experience various trials, knowing that the testing of your faith produces endurance. But endurance must do its complete work, so that you may be mature and complete, lacking nothing. Now if any of you lacks wisdom, he should ask God, who gives to all generously and without criticizing, and it will be given to him.
James 1:2-5
Endurance Unleashes Character
As God produces in us greater fortitude and capacity to deal with more hardship, He brings out character. Character is the image of Christ that’s present in us being made clearer. In essence, character means to expose the quality of …
via prostheticknowledge.tumblr.com
Twitter bot by Tom White applies new smiles or frowns to random images of people using neural network analysis:
I take examine images of people and then add or remove smiles. Reposting images from my Following list. #NeuralPuppet bot
via prostheticknowledge.tumblr.com
Brilliant Net Art music video for track by Cumhur Jay put together by Akihiko Taniguchi combines photogrammetry models and MOCAP dancing, put together in the Unity gaming environment:
Taken from Cumhur Jay first album, “Dyschronometria”, available on 23 June 2016
Label: HIGH:Controla / Subterfuge Records
highcontrola.comMusic produced by Cumhur Jay
Video produced by Akihiko Taniguchi
via www.dataquest.io
This is the second in a series of posts on how to build a Data Science Portfolio. If you like this and want to know when the next post in the series is released, you can subscribe at the bottom of the page.
You can read the first post in this series here: Building a data science portfolio: Storytelling with data.
Blogging can be a fantastic way to demonstrate your skills, learn topics in more depth, and build an audience. There are quite a few examples of data science and programming blogs that have helped their authors land jobs or make important connections. Blogging is one of the most important things that any aspiring programmer or data scientist should be doing on a regular basis.
Unfortunately, one very arbitrary barrier to blogging can be knowing how to setup a blog in the first place. In this post, we’ll cover how to create a blog using Python, how to create posts using Jupyter notebook, and how to deploy the blog live using Github Pages. After reading this post, you’ll be able to create your own data science blog, and author posts in a familiar and simple interface.
…via opiateforthemass.es
All the shots and FT attempts in one animation made with NBA
spatio-temporal data (maintained by neilmj) and paper.js.
The data is from Golden State Warriors vs Denver Nuggets on January 13th 2016.

I took the following simple two steps.
The final goal of this step is to generate a JSON file for Paper.js.
Concretely I like to have
Let’s first get the data.
importjsonimportpandasaspdimportosimportnumpyasnpfromcollectionsimportdefaultdictfromitertoolsimportcompressimporturllibos.chdir('PATH/TO/YOUR/WORKINGDIRECTORY')tid='1610612744'# Team ID for GSWgid='0021500583'# Game ID of this game# Let's get the datadatalink=("https://raw.githubusercontent.com/neilmj/BasketballData/""master/2016.NBA.Raw.SportVU.Game.Logs/01.13.2016.GSW.at.DEN.7z")# You can either download the data and unzip the above URL manually or do the# followingos.system("curl "+datalink+" -o "+os.getcwd()+"/zipped_data")os.system("7za x "+os.getcwd()+"/zipped_data")# This should output 0021500583.json in your working directorywithopen('{gid}.json'.format(gid=gid))asdata_file:data=json.load(data_file)# Load this json# You can explore the data here if you like# Following code and we get player lists for both home# and visitorshome=[data["events"][0]["home"]["players"][i]["playerid"]foriinxrange(len(data["events"][0]["home"]["players"]))]visitors=[data["events"][0]["visitor"]["players"][i]["playerid"]foriinxrange(len(data["events"][0]["visitor"]["players"]))]pids=home+visitors# This is going to be a list of all the player IDsIn the next snippet, we are going to call a play by play API from stats.nba.com/.
Play by play data contains how each event ends up like 2PT attemps, rebound,
turnover or substitution.
We are going to use this information to get only field goal and free throw
attempts.
os.system('curl "http://stats.nba.com/stats/playbyplayv2?''EndPeriod=0&''EndRange=0&''GameID={gid}&''RangeType=0&''Season=2015-16&''SeasonType=Season&''StartPeriod=0&''StartRange=0" > {cwd}/pbp_{gid}.json'.format(cwd=os.getcwd(),gid=gid))# Download json from the APIpbp=pd.DataFrame()withopen("pbp_{gid}.json".format(gid=gid))asjson_file:parsed=json.load(json_file)['resultSets'][0]pbp=pbp.append(pd.DataFrame(parsed['rowSet'],columns=parsed['headers']))# Conver only the necessary part into DataFrameshot_events=pbp[pbp["EVENTMSGTYPE"].isin([1,2,3])]["EVENTNUM"].values# EVENTMSGTYPE is how an event ends up# 1: FG made# 2: FG missed# 3: FTraw_json=list()foreventinxrange(len(data['events'])):#for each eventifeventinshot_events:# if event was any attempt at a rimfornuminxrange(0,len(data['events'][event]['moments']),1):# for each record of data. apparently every 0.1-0.2 secondlstlsts=data['events'][event]['moments'][num][5]# this block contains spatio-temporal data for all the players on# the courttmplst=list()forpidin[-1]+pids:# for each player and ball (pids -1)ifany(pidinlstforlstinlstlsts)==True:# for each playerindx=[pidinlstforlstinlstlsts]# get an array index of a playerrw=list(compress(lstlsts,indx))[0]# and get the row itselftmplst.append(rw[2])# X coordinatetmplst.append(rw[3])# Y coordinateelse:tmplst.append(None)tmplst.append(None)# Add None if the player is on benchraw_json.append(tmplst)json_df=pd.DataFrame(raw_json)json_df.fillna(0,inplace=True)# get all tthe resting players to (0, 0)json_df.drop_duplicates(inplace=True)json_df has X, Y coordinates of all the players per observation.
Each row is a time (recorded every 0.1 - 0.2 sec).
Column zero is a X coordinate of player 1 (pids[0]), column one is a Y
coordinate of the same player, column two is a X-coordinate of player 2 (pids
[1]) and so on.
The last trick needed is to convert Python DataFrame to a right for Paper.js.
There are more than one way to do this but we are going to make a nba_data.js and define JavaScript variables in there.
json_str=json_df.drop_duplicates().values.tolist()json_str="var DATA = "+str(json_str)+"\n"json_str+="var count1 = "+str(len(home))+"\n"json_str+="var count2 = "+str(len(pids)+1)+"\n"json_str+="var pids = "+str(pids)withopen('nba_data.js','w')asf:f.write(json_str)Now we got the data and now we are going to make animation in JavaScript.
The below is a simple html skelton.
Put this in the project folder so this can find nba_data.js.
I downloaded Paper.js by bower install paper so the location might be
different from bower_components/paper/dist/paper-full.js depending on how
you download the library.
"nba_data.js">"text/javascript"src="bower_components/paper/dist/paper-full.js">"text/paperscript"canvas="myCanvas">As you can see in the script tag above, Paper.js needs a special
type=”text/paperscript” and canvas=ID.
The content of a canvas is shown in html part.
The last part is to put the following in the above WE ARE GOING TO FILL IN HERE.
// We start with making 11 circle objects with Path.Circle, which are// essentially going to be wrapped up into Symbol objects// Ball comes firstvarpath0=newPath.Circle({center:[0,0],radius:3,fillColor:'brown',strokeColor:'brown'});varsymbol0=newSymbol(path0);// White and blue color home court jersey for Denver Nuggetsvarpath=newPath.Circle({center:[0,0],radius:3,fillColor:'white',strokeColor:'skyblue'});varsymbol=newSymbol(path);// Blue and yellow away jersey for Golden State Warriorsvarpath2=newPath.Circle({center:[0,0],radius:3,fillColor:'blue',strokeColor:'yellow'});varsymbol2=newSymbol(path2);// Assign center and scale for the 11 objectsvarcenter=Point.random();varplacedSymbol0=symbol0.place(center);placedSymbol0.scale(1);for(vari=1;i<=count1;i++){varcenter=Point.random();varplacedSymbol=symbol.place(center);placedSymbol.scale(1.5);}for(vari=count1+1;i<=count2;i++){varcenter=Point.random();varplacedSymbol2=symbol2.place(center);placedSymbol2.scale(1.5);}// Everything in onFrame will be in animation// When this function is defined, it is called up to 60 times a second by Paper.js// The number of count is obtained by event.count so using this to assign// new position to each objectfunctiononFrame(event){project.activeLayer.children[0].position=[DATA[event.count][0]*3,DATA[event.count][1]*2.5];for(vari=1;i<=count1;i++){varitem=project.activeLayer.children[i];item.position=[DATA[event.count][(i*2)]*3,DATA[event.count][(i*2)+1]*2.5];}for(vari=count1+1;i<=count2;i++){varitem=project.activeLayer.children[i];item.position=[DATA[event.count][(i*2)]*3,DATA[event.count][(i*2)+1]*2.5];}}The final output in html is a smooth one game shot highlight animatioin too big to be fit in this post. so here are some GIF extractions from the original JavaScript animation.


Though I prefer a black background with circle objects moving around, you can draw a basketball court or replace circiles with player photos (you know, there’s also API for photos).
The full code is available here
Animate NBA shot events with Paper.js was originally published by Kirill Pomogajko at Opiate for the masses on June 08, 2016.
via www.infoq.com
The jQuery team has unveiled the long-awaited 3.0 release, bringing a new slimmed-down option as well as major new features, improvements, and bug fixes.
By James Chestersvia thenewstack.io
Is Ansible really heads and shoulders about Puppet and Chef in the world of container orchestration? Several readers asked this question after reading our recent survey’s results. The answer is maybe, but there are reasons to believe the data.
After the Red Hat’s acquisition of Ansible last year, many of its customers may have chosen Ansible in the hopes it will integrate with other Red Hat offerings. The data supports this view as seven of the twelve respondents citing Red Hat’s OpenShift also plan to use Ansible.
We have also seen trends that indicate Ansible is picking up steam. Most recently, in an OpenStack user survey, Ansible made up a 14-point deficit compared to six months ago to become virtually tied with Puppet as the leading way to deploy/configure OpenStack clusters. Why this is the case, we’re not sure. However, one reason may be that Ansible’s online community is particularly strong. In fact, two years ago, we published a data-driven story that foretold Ansible’s strength among Docker users.
Ansible was the second most likely container orchestration tool to be included on user’s roadmaps. Note that respondents were able to choose three products, so Ansible was often cited along with one of the major orchestration platforms.
Ansible’s prominence is being chosen to be used alongside focused orchestration tools like Kubernetes, Swarm and Mesos. In fact, fifty-six percent of Ansible respondents say their current primary method of orchestration is “orchestration platform,” which is higher than the study average of 45 percent.
Along with Ansible, configuration management tools like Puppet and Chef were much more likely to be cited by people using containers in non-production environments. As production deployments of containers increase, these vendors will face the challenge of proving that they should continue to be part of end users’ stack.
Chef, Puppet and Ansible all do well among those using containers in non-production environments.
Feature image via Pixabay.
The post TNS Research: Is Ansible Really Leading Chef and Puppet for Container Orchestration? appeared first on The New Stack.
via thenewstack.io
At a recent Varnish Summit in San Francisco Vitaliy Kushnerov, principal IT infrastructure architect at Tesla Motors and Rajasekar Jegannathan, a Tesla Web platform architect talked about how they created a private Content Delivery Network (CDN).
In 2013, the year that the Tesla Model S was the best car ever tested by Consumer Reports, the IT team realized their current infrastructure was not scalable. They needed a CDN that provided a caching engine, a robust Geo-DNS, and service discovery all that performed consistently across the globe.
Don’t we all?
The Tesla website is heavy on video content and imaged documents, which both consume space and take time to download.
The company realized it was not using its resources optimally, said Kushnerov. Customers connect to the service center, and they wait. “So they’re sitting there thinking ‘What a beautiful car, but they can’t get their service process right.’”

A small team created to identify the problem and suggest solutions started by asking what was going wrong? How could they better use existing infrastructure and existing services?
Analysis revealed there were multiple places where the same content was transferred over and over again. “The question then became: ‘How can we pass the data once?’,” said Kushnerov.
A CDN was the obvious answer. But at that time, no reliable CDNs extended reliability into China. Global consistency was critical to Tesla. The team decided a private CDN controlled in-house and under the Tesla umbrella was the way to go.
Once this was finalized, Kushnerov and Jegannathan sat together in front of one monitor and built a proof of concept for the Tesla CDN in about 5 hours. So it turns out that the rumors of Tesla being run like a start-up are true.
The proof of concept in hand, Jegannathan went on to completely architect the project and take it to the level it is right now – globally active and used by thousands of people in the company.
The biggest challenge, Jegannathan said, was to deliver the same user experience across the globe, especially in China. He got help from other Tesla developers, who passed on information about traffic patterns for the data across the globe.
From this information, he created requirements for a CDN provider:
 Enter Varnish, who not only checked off all these boxes but agreed to work with Jegannathan to make his proof of concept work.
Varnish offers an open source HTTP accelerator for large Web-based sites, and a recently released MSE (Massive Storage Engine) module provides a way to both cache large amounts of data, that, should the system crash, can be quickly reloaded.
“Put in front of application server; it is super simple. Therefore, it is also 200 – 1,000 times faster. So every time you move data from caching layer to application server, Varnish will supply the data in 30-40 microseconds as opposed to typical cache which is 10 – 20 milliseconds,” said Pers Buer, founder and chief technology officer of Varnish Software, in an interview earlier that day.
In response to Jegannathan’s request, Varnish engineers coded changes to the MSE to accept re-directs. Now, when a request comes into the Tesla network, the process looks at a map and selects the closest location, then re-directs the request to that location. The Varnish software team worked with Jegannathan all throughout the proof of concept to code new functionality to make Varnish work for Tesla.
Best of all, according to Jegannathan, the VCL (Varnish Command Language) gave him control over the CDN. “I love VCL,” he enthused.
Now the Tesla CDN keeps only one copy of each video no matter how many people are trying to fetch it. So if six people want to see the same 7.5 gig video, it is only retrieved once. Jegannathan considered that a big win because there was no money for adding hardware.
Varnish uses one CPU, and even that is partitioned, with priority given to services, then video, then other applications that use images. Also, he’s found that the CDN does not use very much memory, which is also a win.
Also, the “pre-fetching” process constantly looks for any new software/videos available. For example, in Europe, there are five high-volume sites, and the system pre-populates popular caches for those high-volume regions.
Regional tiers can also be pre-warmed for critical sites, meaning that the most oft-used content is downloaded before a request is made. For example, China’s region can be pre-warmed which solves a lot of delivery issues. Local sites are not pre-warmed.
On the backend, Jegannathan created a process in VCL that monitors the hardware. If any piece goes down, the process simply redirects to a different server with no engineer engagement. With video streaming, engineers have visibility across the globe. If any problems arise, a technician can see that and fix issues.

With all this as a base, Jegannathan built a four-tier CDN system.
High availability was critical to delivering content to a customer, he said, so it is used for Tiers 1 and 2. Tiers 3 and 4 use a console for service delivery.
Traffic to the company’s website is currently only 2,000 – 10,000 downloads a day, but the size of the content is very big – up to 1.7 gigs per file. This information was critical in determining how the system was built. Different decisions would have been made if the traffic load were higher, J pointed out.
The future for Tesla’s CDN? “Cache in a box,” said Jegannathan. Need a new server due to increasing traffic? Ship one box, with the CDN, pre-loaded for a plug-and-play upgrade.
It’s amazing what one engineer with management support and a start-up environment can do.
Feature Image: Tesla Roadster, Tesla.
The post How a Single Engineer used Varnish to Build Tesla a Private CDN appeared first on The New Stack.
via prostheticknowledge.tumblr.com
YouTube channel featuring visual experiments with CreativeAI and pop culture.
First, two artistic style transfer videos, the first featuring a performance from Frank Zappa using various album covers of his work as the source:
Next, a Jimi Hendrix performance using artworks by Moebius who occasionally featured Hendrix in his own work:
And lastly, using automatic colourization method, a monochrome James Brown performance is presented in colour:
You can find out more at the channel here
via prostheticknowledge.tumblr.com
Neural Doodle Selfie Vid, styled by Lucien Freud


