Intent:
via www.xaprb.com
One of the core teachings of Drucker’s classic “Managing Oneself” is to form hypotheses about what you’ll do well or poorly, and then observe the outcomes. By repeatedly practicing this, you learn what you’re good and bad at.
![Compass]()
At some point I noticed that I sometimes wasn’t certain why I failed or succeeded. As I’ve explored this more deeply in the last few years, I’ve come to see that the biggest factor in my success or failure is often the clarity of my purpose itself.
One Of Our Quarterly Goals
A large company once asked for a call to discuss a potential partnership. This was the type of thing one does not simply brush off, so despite the fact that it wasn’t a current focus for our team, several of us put aside our work to discuss the opportunity. On the call, the person who invited us mentioned that expanding their partnership program was one of their quarterly goals. Hearing this made me feel even more excited. This wasn’t a random call! This company was committing resources and energy to this! I left the call energized about the possibility of an alliance with a brand that could vault us into the spotlight.
Later, I put myself mentally in the other person’s shoes. Wasn’t it convenient for them that when they had a quarterly goal of expanding their partnerships, they were able to find companies like ours? Companies that would align their activities and resources around efforts they hadn’t planned? This isn’t meant to express any cynicism or resentment, just to state a fact.
Put another way: under what circumstances would they have found us not willing to engage, even if we’d agreed the alliance would be beneficial? What kind of culture or thought process would that reveal?
I Was Recruited
I often ask people their career story, including the reasons for job changes. Something about telling this part of their story brings out thought patterns.
I spoke to someone who told his career story like this. “I worked for Company A for a while, then I was recruited to Company B by the CEO. After a couple of years, I was recruited into Company C.” This went on; I listened. At the end, I asked, “How did the CEO of Company B recruit you?”
There was a pause. “I received a call from him and was offered the job.”
This person was a senior executive, generally very direct, clear-spoken, even forceful and inspiring. In contrast, the story of his career decisions was entirely in the passive voice from the first word to the last. Whose decisions were they, really? He didn’t seem to hear himself saying that they weren’t his own.
I Reached Out To Follow Up
For years, I’ve worked in software development teams that use daily stand-up meetings. These meetings are meant to be short; you do them standing up to encourage that. Specifics vary, but generally you go around the circle and say what you’re working on and whether anything is blocking you. As simple as it sounds, these meetings are hard to do well.
I once encouraged a different non-software team to adopt something similar: a daily huddle every morning. I asked them to use a very specific format: what did you achieve yesterday, what results do you commit to achieving today, and what’s blocking your progress?
I found that some people were unable or unwilling to adhere strictly to the format. Instead, they’d say things like “yesterday I reached out to John about their account, touched base with Sue on the status of legal, and followed up with Mary about their contract. Today I’m going to call Phil.” All the reaching out, following up, and so forth made it impossible to tell what this person actually did yesterday; was it emails? Voicemails? Conversations? Dials that didn’t connect or got a busy signal? Likewise, calling Phil is not an achievement, it’s an activity. What are you going to achieve today?
Another type of useless meeting is a status update, which feels monotonous. “I’m working on John’s account, Sue’s legal revisions, and Mary’s contract. Today I’ll call Phil.” A lot of stuff is in-progress, but is it progressing? What does “working on” mean? What concrete outcomes need to happen next, what activities will create those outcomes, and do you commit to completing them today?
It takes a lot of calibration to get these meetings right. The leader usually needs to coach each person in one-to-one meetings to make the format work well and get the true point across. If meetings drift into vagueness or status updates, people hear each other saying the same thing every day, the meeting feels the same each day, it’s pointless, and true engagement never gets a chance.
Done well, though, the meetings create clarity, accountability, and peer pressure in a very short time. What you’re really doing is committing to achieving specific outcomes today and revealing whether you kept yesterday’s commitments. If you’re not getting that from the meeting, you’re doing it wrong; if you’re doing it wrong, it’s because of people’s mental approach to the meeting. Insisting on achieving commitment, transparency, and accountability in the meeting forces team members to adopt the right mindset, or makes it blindingly obvious that they can’t or won’t. It’s simple, but hard.
Come What May
I wrote a while ago about spending the end of the day prioritizing what you’ll do the next morning. As I was explaining this productivity technique to someone, I couched it in terms of the daily huddle. “Decide what you’ll achieve tomorrow,” I said. He pointed out that many disruptions arise in an 8-hour day, and if he chooses 8 hours of goals, he can achieve them only by disconnecting from the Internet and isolating himself from others.
This helped me realize that I wasn’t stating explicitly what I meant. I don’t mean you should pick enough things to schedule your day fully. I mean that it’s highly productive to prioritize two, three, maybe five things if they’re small, which together constitute maybe 30-60 minutes of work; 90 minutes if you’re lucky. These are concrete, specific outcomes you want to achieve, come what may. You will do many, many more things during the day, but you make a fierce commitment to yourself that at the end of the day, there is no way in hell you won’t achieve these specific results.
The Second Habit
Stephen Covey’s book The Seven Habits Of Highly Effective People was probably the first such book I ever read, and remains highly influential in my life. The second habit is “Begin With The End In Mind.” What specific result do you want to produce?
Motivation
I’ve asked a lot of people what motivates them about their careers and their work. The answers vary a lot, but there are common themes. Over time I’ve distilled these down. I have a longer document, but in brief,
- People want to be challenged
- People want to grow and improve
- People want their work to have impact
- People want to have responsibility
- People want to do great work
- People want to be free of obstacles that slow them down, such as bureaucracy
- People want stellar team mates
It’s interesting that I don’t recall anyone telling me that feeling purposeful motivates them. But I’ve tested this many times, and I’ve found that pretty much anything I do is ten times more motivating when I have a definite intent for it. Seriously: if I go to the gym with the intent to finish some workout, the workout comes and goes and I move on to the next part of my day. If I go with the intent of doing the right amount of the right kinds of exercises to make me healthier and stronger for achieving my life purpose, no more and no less, then it’s completely different. I get in, get it done, and leave when I’ve met my goals for that activity.
And while I’m doing that, I’m on fire. There’s no other way to say it. When I approach my day this way, I am absolutely charged up all day every day. I recommend trying it if you’ve never had that feeling.
Maybe it’s easier to understand as the opposite. You know that feeling, when the day is over and you were “busy” the whole day, but you can’t really say what you did, specifically? You probably took things as they came to you. You feel tired, pointless, unclear. You feel that your efforts had no real impact or purpose. It’s not only demotivating, it’s demoralizing.
The antidote to that is having a Post-It note prepared, with three small things you chose last night. At the end of the day you look at the note and you can say, “yes, I definitely did achieve three specific things of my choosing today.” You still handled 98% of the same reactive stuff, answering emails and putting out fires and whatever else the world threw at you. But it’s totally different, because you Got Shit Done, too. You feel amazing about the three little things, and pretty damn good about the rest.
What I’m saying is that being purposeful is highly motivating and makes everything fun and rewarding.
What do you suppose happens to teams when they engage in a few moments of
purposefulness at the beginning of every day? Could a short “huddle” meeting
help everyone feel turbocharged all day? Why do football teams do huddles,
anyway?
With No Agenda
Indulge me in a thought experiment. Let’s assume that all people live on a spectrum of purpose. They are more or less intentional and results-oriented. I’ll make up some fictional characters to illustrate this and use later in this post. Note: this is intentionally extremist for pedagogical purposes.
On the one extreme is Susan, the person who can instantly answer why she’s doing something. She knows not only the driving force behind her activities, but the specific outcome she wants to achieve, and how that outcome will produce the benefits she desires. Susan is so focused on this that she never does anything without first determining its purpose, whether that aligns with her goals, whether there’d be a better way to achieve those goals with more efficient use of time, money, people, and other resources, and so on. She is extremely purposeful.
To make this more concrete, imagine Susan talking a walk in the park. She won’t do that without first determining if her goal is recreation, fitness, socialization, or so forth. And she likes to maximize her results, so she’s probably going to power-walk with her friend and her dog while practicing deep conscious breathing. She takes the route that ends near a good spot for stretching.
The other extreme is Jacob, the completely passive person. He doesn’t have his own agenda. He does things because why not? Or maybe he does nothing unless he has to. Whatever, dude.
Now ask yourself, has Susan looked around the world and noticed people like Jacob? Of course she has. She’s concluded that these people have 24 hours in a day just like her, but they’re wasting them on nothing particular. Susan therefore decides that if the Jacobs of the world are going to waste the resources and abilities they’ve been given, she might as well put them to good use herself.
The Jacobs of the world are going to find themselves doing what the Susans want to be done. The Jacobs, lacking their own priorities, deciding not to decide, will find that the Susans set their priorities for them. Lacking motivation, Jacobs will find themselves in situations others have created to provide motivation, often in the form of negative consequences. Show up to flip burgers, Jacob, or you’re going to miss your rent payment!
If you’re familiar with the movie The Big Lebowski, it has a few good
character studies at various points on the spectrum of intentionality.
At some point I realized about Jacobs and Susans. I asked myself, do I want someone else to choose what I achieve with my life? Because if I don’t take ownership of my priorities, that’s exactly what’s going to happen. There’s no escaping it: if I’m not working on achieving my agenda, I’ll achieve someone else’s. So I’d better have an agenda of my own.
Schwarzenegger
Arnold Schwarzenegger is a great example of a hyper-intentional person. I would not choose to emulate what he’s done with his superpowers, but I think if you study him sincerely, you’ll be forced to admire his purposefulness.
His life story is the most dramatic example I know of consciously selecting what he wants, making a well-thought-out plan to achieve it, and aligning his full efforts behind that.
For example, he’s probably best known as a bodybuilder, but that was only a means to an end for him. One of his goals was to create his own niche as an actor. At the time, it would be an understatement to say there was no demand for musclebound actors with thick accents. The contemporary fashion was the exact opposite. He saw that as an opportunity: he’d create the category and utterly own it because no one else wanted it.
There was a problem; there was zero money in bodybuilding, and he knew an acting career would be financially unstable. So he analyzed the economy, realized there was a huge opportunity in real estate, and made a series of extremely lucrative investments.
Oh, and he recruited a bunch of other bodybuilders to work in his businesses, too. From the descriptions of them, many of them were named Jacob. Arnold didn’t settle for putting his own efforts into his life plan; he pulled everyone else into it too.
And so he went from an extremely driven kid in Austria to governor of California, seemingly unstoppable. At every step in his career, if you analyze him, he was juggling a dozen very carefully selected balls in the air, each with a specific purpose and outcome in mind. Some he found by “luck” and seized the opportunity; others he created from sheer force of will.
It’s Not Mystical
I’m not the first person to observe the correlation between purpose and results. People have called this a hundred different things, and practically every self-help or success book discusses it. Many of them wrap it in hogwash mysticism. It’s popular recently to dress it up in nonsense about laws of the universe and quantum physics and so on. In my view it’s quite simple and straightforward. If you decide which direction to travel, you’ll make progress towards it because you’ll correct your course as life tosses you off track. If you just go the way you’re headed, you won’t make progress towards a discernable goal. Nothing metaphysical about it.
No one should disparage those who live the journey for its own sake. It’d be a great pity to waste your life on a goal, arrive at the end, and discover that you don’t like the goal you chose, and you wish you had another chance.
Systems
I’ve been studying some books that discuss systems for goal-setting, such as OKRs. I welcome your thoughts. I don’t have a perfect system for helping everyone set goals in a way that doesn’t require a lot of effort and is part of the company culture. I don’t feel the need to invent something.
From Macro To Micro
Since noticing how much more efficient my efforts are when there’s a purpose to them, I’ve gotten kind of maniacal about it. In the ideal world, I’m an exemplary Susan. When I achieve that, I’ll have a purpose for everything:
- I’ll have a purpose for my life. (I’ve had that since first reading Stephen Covey.)
- I’ll have a purpose for my company. (Had that since before founding it.)
- I’ll have a purpose for defined periods of time in the company, such as quarters and biweekly sprints. (Working on it; small steps; see above.)
- I’ll have a purpose for each team and each person in the company. (My coach has taught me to use a document called a Job Defined Agreement for everyone. It essentially states the purpose of their work.)
- I’ll have a purpose for every day of my life. (I do this; I am mostly successful; say 90%).
- I’ll have a purpose for every meeting, email, phone call, project, everything.
I try. I try to move in macro cycles of purpose that contain micro cycles: quarterly, weekly, daily, minute to minute. What am I doing? How does it contribute to the intent I have chosen?
Before I pick up the phone: what specific outcomes do I want to get from this call? How, specifically, can I do it?
Before I ask so-and-so for a meeting: what is my goal for this meeting? If I ask for the meeting without being clear in my intent, I’m much less likely to get the meeting, or to get the outcome I want. If I have the intent clear in my mind first, I am already on the right track before I even compose the invitation.
From the large scale to the small scale, there are big goals and there are activities to get to those, and each bit gets broken down into smaller bits, each of which requires focus and intent from moment to moment.
Risks
There are a few risks. One is ever-present for me: whenever something is working for me, I’m impatient to double down on it. I repeatedly get feedback from family, colleagues, and friends that I’m devoting my entire energy and focus to something new to them, something they haven’t had time to adjust to. Maybe I picked up a new book and read it over the weekend. Suddenly being around me is like a firehose of whatever was in the book. Next weekend, I’ll read another book, so watch out. I can give people whiplash if I’m not careful.
Another is the risk of getting too focused on outcomes and forgetting to smell the roses. In some matters, it’s good to be running through walls getting things done. But is that the right way to approach the relaxing afternoon on the patio with good friends, a glass of wine, and a plate full of cheese and fruit? If it’s been raining for weeks straight and the weather clears, maybe there should be no higher purpose than enjoying how glorious the fresh air and the sun feel.
There’s also the risk of being impatient with people. If I’m too selfishly focused on achieving outcomes, the end might justify the means. I continually see cautionary tales of people who let this get out of hand and end up hurting people. I think the danger zone is when you forget that the world doesn’t exist for you alone. I don’t like people who have no use for people who are no use to them. I don’t want to be that person.
Closing Thoughts
This blog post might have seemed rambling, perhaps even purposeless. That’s not the case, however.
It’s a letter to myself in the future, because I’ve repeatedly learned from my old journals and other writing. I’m sharing it publicly with the goal of learning from you.
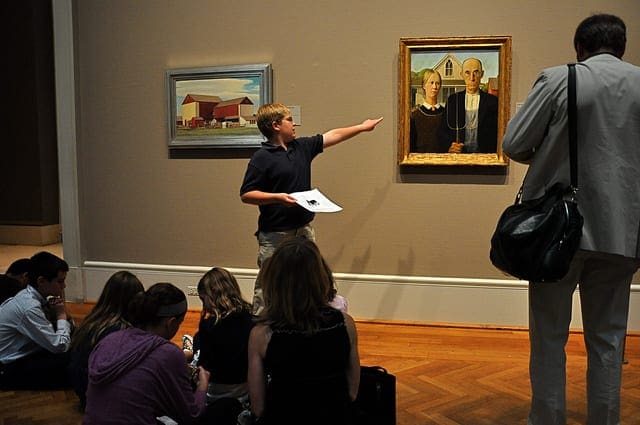
Photo Credit.


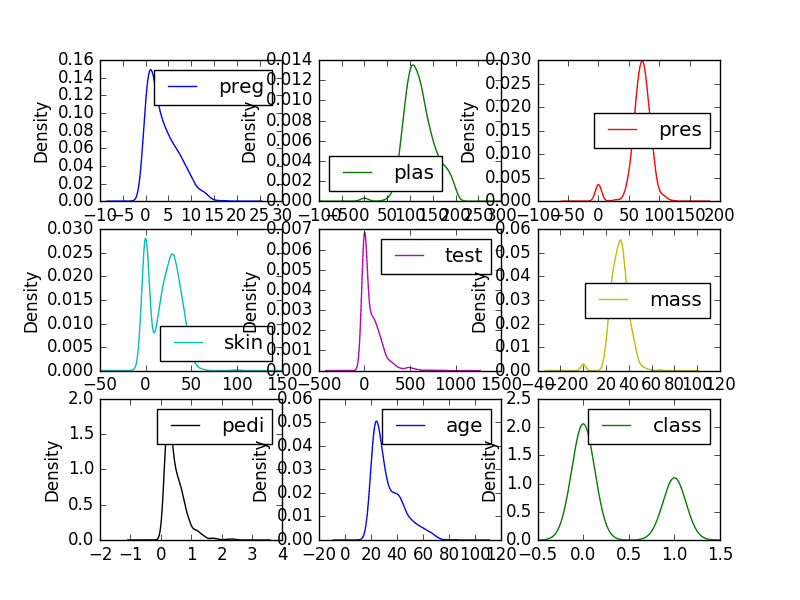
 Python and scikit-learn are the rising platform among professional data scientists for applied machine learning.


 One of Eric Fischer’s tweet maps. Images
  Twitter Map, “Los Angeles,” 2014
 Twitter Map, “O’Hare,” 2014


 “HPE is committed to meeting customers where they are,” said
  During the first round of keynotes Tuesday, HPE CEO Whitman was joined on stage by
  olution.”


